Limited computational resources means we have to be smart in how we use them to create weather forecasts
Expanding the ensemble size increases accuracy of a probabilistic forecast but it is expensive
and so we have to know if it will be worth it.
Summary
Summarised from original publication by myself, George Craig & Jonas Brehmer
One main way in which the accuracy of probabilistic forecasts can be improved is by increasing the ensemble size. It is unclear however how the sampling error decreases with ensemble size however, and the larger the ensemble, the more expensive the forecast is to run. We address this question of how large an ensemble should be. We do this by developing a simple model which recreates a weather forecast model, but which is cheap to run and therefore can run up to 100,000 forecast models at once. From analysing the sampling error as a function of ensemble size, we find there's an asymptotic behaviour, whereby the error decreases proportion to (ensemble size)-1/2. With this relationship in hand, operational forecast modellers can now predict how their sampling error will decrease with further investment in ensemble size, and will be able to quantitatively reason whether it will be worthwhile.
Paper
published in Quarterly Journal of the Meteorological Society
Presented orally at European Geosciences Union General Assembly 2022
Model
A one-dimensional idealised model of cumulus convection, based on Würsch and Craig (2014), to simulate key processes of midlatitude atmospheric convection has been developed. The model is computationally efficient, allowing for large ensemble sizes (~10⁵), and captures the nonlinear and intermittent dynamics of convective systems. It employs modified shallow-water equations with three main variables (wind, height, and rain) which are seen in this figure, and is incorporating simplified physics for cloud formation and decay through buoyancy thresholds and rain-induced downdrafts.
The model realistically reproduces convective lifecycles, cloud distributions, and spatial randomness, as seen here, whereby clouds (dark green) are created in the 100km wide domain as well as dissipate after a few hours.
Statistical methods
Statistical inference is used to estimate the sampling error in ensemble forecasts of various sizes, from 2 members to 100,000.
Each ensemble member is treated as a finite sample drawn from an unknown underlying distribution, and the sample statistics from the ensemble (e.g. mean) are random variables that estimate true population parameters (like the expectation, μ).
The uncertainty of these variable is then the spread of their respective distributions.
Since the true distribution is unknown, nonparametric bootstrapping with replacement is used to estimate the underlying distribution of the variables. This involves resampling with replacement from the ensemble data to generate many "bootstrapped" datasets.
Each resample yields a statistic (e.g., a mean), and the distribution of these bootstrap statistics approximates the uncertainty in the estimate. This is known as the bootstrap principle.
In this study:
- Bootstrapping with replacement is applied 10,000 times to a 100,000-member ensemble.
- The effect of ensemble size on uncertainty is examined by subsampling the full ensemble.
- 95% confidence intervals of the bootstrap distribution are constructed using the percentile method to measure uncertainty for the mean, variance and various percentiles.
- Confidence intervals versus ensemble size are plotted on a log-log plot.
The distribution of forecast variables is also of interest as it can indicate how realistic the forecast model is, and gives insights to other statistics. We use the following statistics to quantify the distribution shape:
- Sample skewness: A measure of the asymmetry of the distribution of sample data around the mean.
- Sample excess kurtosis: A measure of the "tailedness" of the sample distribution compared to a normal distribution.
- Kullback-Leibler (KL) Divergence: A measure of how one probability distribution differs from a reference (in this case normal) distribution.
Results
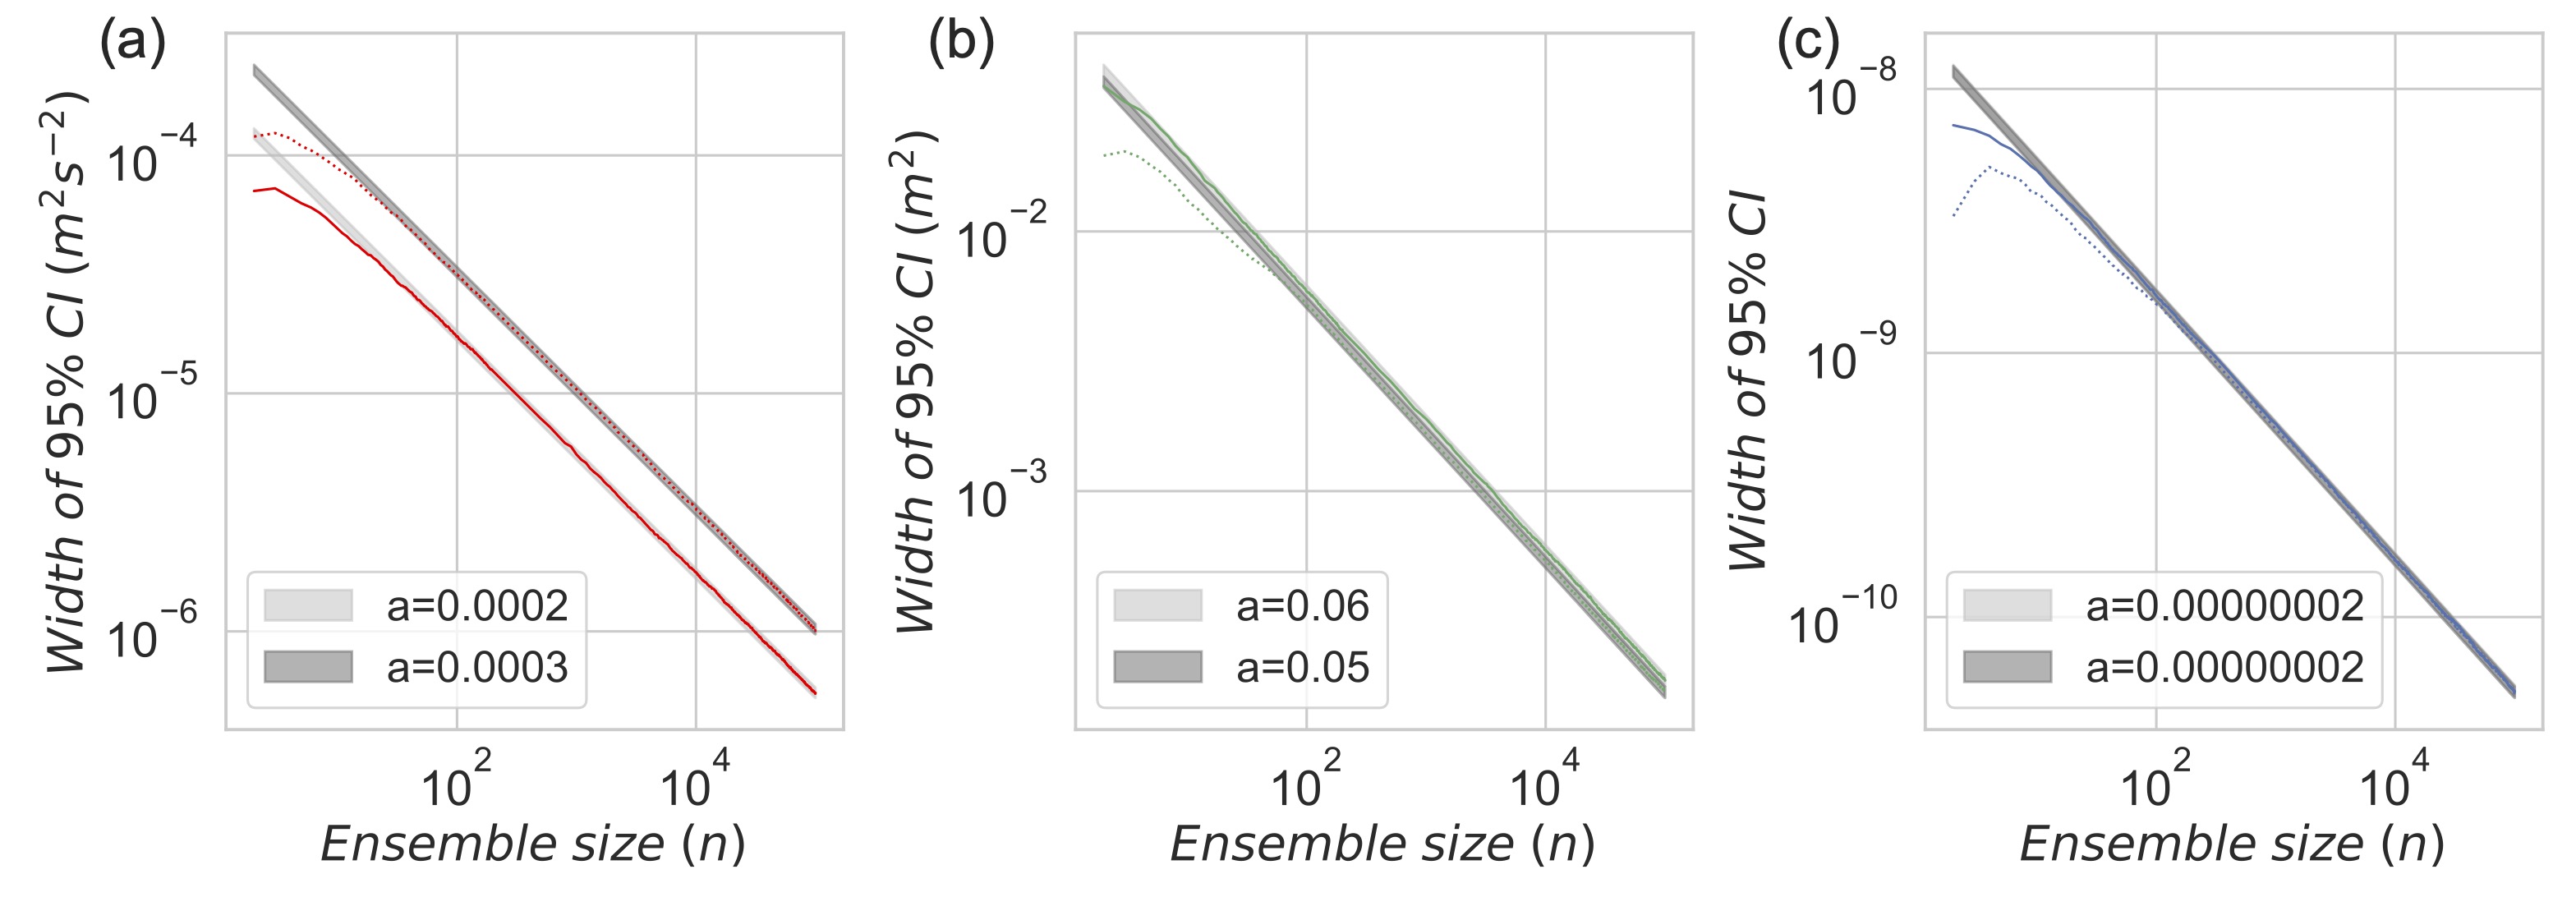
An asymptotic convergence in the limit of large ensemble size (n) was seen in the log-log plots of the 95% confidence intervals for all variables tested (mean, variance, standard deviation, skew, kurtosis and various quantiles).
Seen here in Figure 3 is the sampling error of the variance decreasing proportional to n-1/2 after an ensemble size between 50-100 is reached.
This convergence behaviour is expected from the Central Limit Theorem, which further predicts that the magnitude of the uncertainty depends on the distribution shape, with a large uncertainty for statistics
that depend on rare events. This prediction was also confirmed, with the additional observation that such statistics also required larger ensemble sizes before entering the asymptotic regime.
Conclusion
This study investigated how sampling error in ensemble forecasts decreases with increasing ensemble size, using an idealised convection model to explore the convergence behavior of various statistical properties with ensemble size. It was found that for all statistics tested (and assumably for all those following the CLT), the sampling error will asymptotically converge with enough ensemble members, and decrease proportional to n-1/2. This allows for the effective estimation of how adding additional ensemble members to a probabilistic forecast will further reduce sampling error. As such, forecasters will be able to be able to make better informed decisions when designing ensemble forecast models.
This was a small introduction to our research on estimating sampling error in a probabilistic forecast. Also reported on in this paper is how to estimate sampling error if only a small ensemble is available, and invesigating the sampling error in depth for a large range of quantiles as well as for different forecast distribution shapes.
Definition
- Probabilistic forecast
-
A probabilistic forecast is a prediction generated by running multiple simulations of a model (each an ensemble member) in an ensemble, each with slightly different initial conditions or model parameters, to account for uncertainty and provide a range of possible outcomes. This approach helps improve the reliability and confidence of forecasts, especially in complex systems like weather or climate.
- 95% confidence interval using the percentile method
-
A 95% confidence interval using the percentile method is constructed by taking many resampled versions of a dataset (e.g. via bootstrapping), calculating the statistic of interest for each, and then selecting the values at the 2.5th and 97.5th percentiles of the resulting distribution. These percentiles form the lower and upper bounds of the interval, meaning there's a 95% chance the true value lies within them, based on the resampled data.
- Asymptotic regime
-
The asymptotic regime refers to the behavior of a statistical method or mathematical function as the sample size or some parameter approaches infinity. In this regime, approximations (like normality of the sample mean or convergence of estimators) become increasingly accurate. It’s often used to describe the long-run properties or limiting behavior of estimators and models.
- Central Limit Theorem
-
States that regardless of the original distribution of the population, the distribution of the sample mean approaches a normal distribution as the sample size increases, provided the samples are independent and identically distributed. In addition, the standard deviation of the sample mean (standard error) decreases with sample size, scaling proportional to n-1/2.
- © Untitled
- Design: HTML5 UP